Elise Livingston
Six Flags Lab

Purpose
A person always feels the acceleration of gravity acting on them, but when a person steps onto a roller coaster, the acceleration will vary throughout the ride. The purpose of this experiment was to find the maximum acceleration on the roller coaster Goliath. Along with this task, another purpose of this lab is to find where and at what height this maximum acceleration occurs.
Background
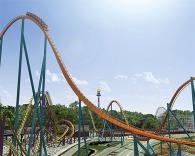
Due to its 4,480 feet of steel track, the colossal Goliath roller coaster in Six Flags over Georgia was built all over and even beyond park grounds. Goliath has no loops, but it achieves a maximum elevation of 200 feet! At the top of this astounding incline, there is an immediate and steep drop. Along with this drop, Goliath also features several more intense inclines and a downward spiral. The maximum speed of this ride is 70 miles per hour (http://www.sixflags.com/overGeorgia/rides/goliath.aspx).
The first descent on Goliath is the largest of the ride and, therefore, it is anticipated that the greatest acceleration would be at the end of this first drop. This is because the ride will be accelerating due to gravity throughout the entire first drop. From this point, the declines become somewhat smaller and, since there are no loops, centripetal acceleration will not be a factor in altering the forces that act on the riders.
The first descent on Goliath is the largest of the ride and, therefore, it is anticipated that the greatest acceleration would be at the end of this first drop. This is because the ride will be accelerating due to gravity throughout the entire first drop. From this point, the declines become somewhat smaller and, since there are no loops, centripetal acceleration will not be a factor in altering the forces that act on the riders.
Equiment
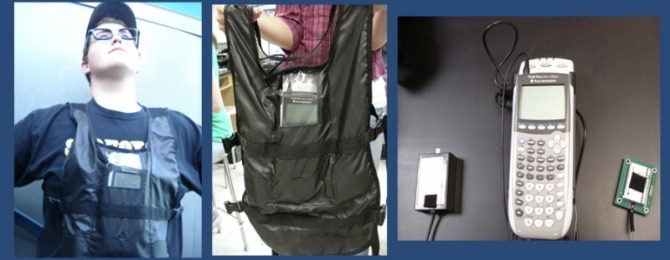
A variety of equipment was used in this experiment. A TI-84 calculator was attached to a CBL unit in order to collect the data obtained. Attached to the calculator and the CBL unit was a single axis accelerometer as well as a barometer. The accelerometer collected acceleration data and the barometer measured the barometric pressure undergone throughout the ride. The data collected by these devices was transferred into several lists within the calculator. In order to carry this accelerometer-barometer-calculator apparatus, we utilized a data vest. The data vest had several pockets to house the equipment and it fastened to the rider securely. We also used a Flip camera to obtain a visual of the ride as it was moving.
Procedure
To begin, the group had to set up the calculator to record the proper data. The following instructions were given to us:
1. Set up data sampling
Use the DataMate Application
For a 2 minute ride: time between samples = 0.5 s
No. of samples = 240
For a 3 minute ride: time between samples = 0.75 s
No. of samples = 240
2. Change triggering
Choose 1 Setup, cursor down to select "mode"
Chose "time graph," Select 3 Advanced
Select 3 "Change triggering," then 4 "manual triggering"
Select 1 OK, then 1 OK until you are back to Main Menu
Select 2 Start
3. Collect Data
When the ride starts: on the CBL choose "start/stop"
After collecting data, choose the Tools option, then choose retrieve data. If you have a full set of data (240 samples), exit the DataMate application. Choose
Programs: ArcData to save your data. You may repeat the experiment 1 time, if needed.
We did steps one and two in class. We also had to connect a barometric sensor and a 1-D accelerometer to channel 1 and 2 of the CBL unit. We had an extra sensor than most groups, and we were also the only group with a 1-D accelerometer. Our data was very different from the other groups since we had to find acceleration and barometric pressure. After setting up all of the equipment, we ran the programs to make sure that they were working properly. While waiting in line for the ride, we tested the programs again and found them to be working. We had to carefully place the calculator and CBL unit in the data vest to assure that no buttons were pressed. We also had to figure out an effective way to press the start button without accidentally pressing the wrong button or having to take out the whole apparatus, which was a difficult task due to the fabric of the data vest. We finally got on the ride and were able to press the proper button, and we collected sufficient data on the first run of our experiment. We were required to graph acceleration versus time and barometric pressure versus time. We also needed to convert barometric pressure data to altitude data and provide a graph for altitude versus time. These graphs are all represented in the data analysis section of this report.
Data
Data Analysis
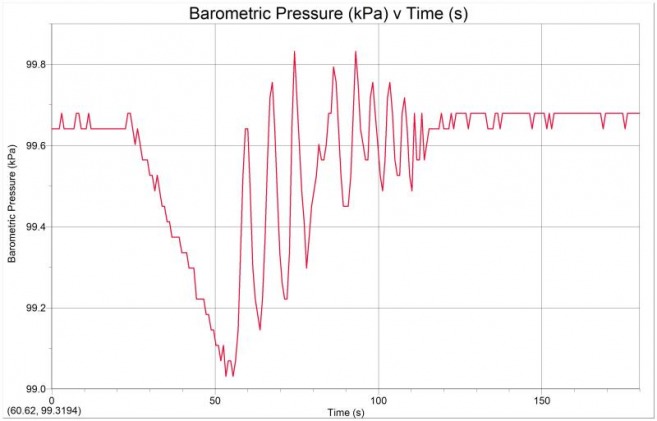
Barometric Pressure (kPa) vs. Time (s)
Acceleration (m/s^2) vs. Time (s)
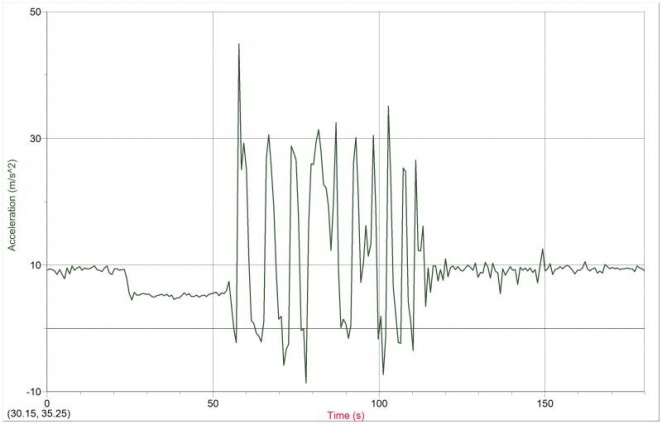
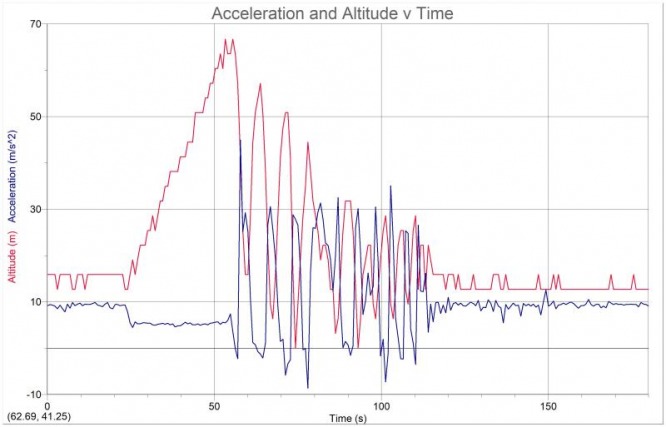
From the graph, we concluded that the maximum acceleration reached onboard Goliath is 45 meters per second squared at t=57.75 seconds.
In our experiment, we used the barometric sensor plugged into the CBL unit to find barometric pressure in kilopascals throughout the course of the ride. To convert this data into altitude, we subtracted every pressure value from the highest one and used the conversion factor of 1m/0.012kPa. This factor created an inverse of the pressure graph, giving us the desired altitude graph. We then transposed the acceleration graph onto the altitude graph. The graph shows that as altitude (m) increases, acceleration (m/s^2) decreases.
After all of the barometric pressure data was converted to altitude data, we figured that since our maximum acceleration occurred at t=57.75 seconds, the altitude at the point of maximum acceleration is 44.95 meters.
Acceleration (m/s^2) vs. Time (s) and Altitude (m) vs. Time (s)
Conclusion
The purpose of this experiment was to determine the maximum acceleation and at what time and height it occurs. We found that the maximum acceleration was about 45 m/s^2 which would equal 5 g's and this acceleration occured at t=57.75 seconds at an altitude of 44.95 meters. There are a few factors that could have caused error in the data. For one, the accelerometer may not have been perpendicular to the ground. This would cause the device to be unable to collect data properly. There could have also been discrepancy in the data due to shaking of the roller coaster. As in most labs, we must also account for the possibilities of human and machine error. A wrong number or button could have been pressed at some point, or the calculator and CBL unit may have not done it's job proplerly in recording data.
